Nay Zaw Aung Win

Mechanical Engineer by degree,
Data Scientist by passion!
View My LinkedIn Profile
Predicting Grain and Seed Oil Production in Ukraine
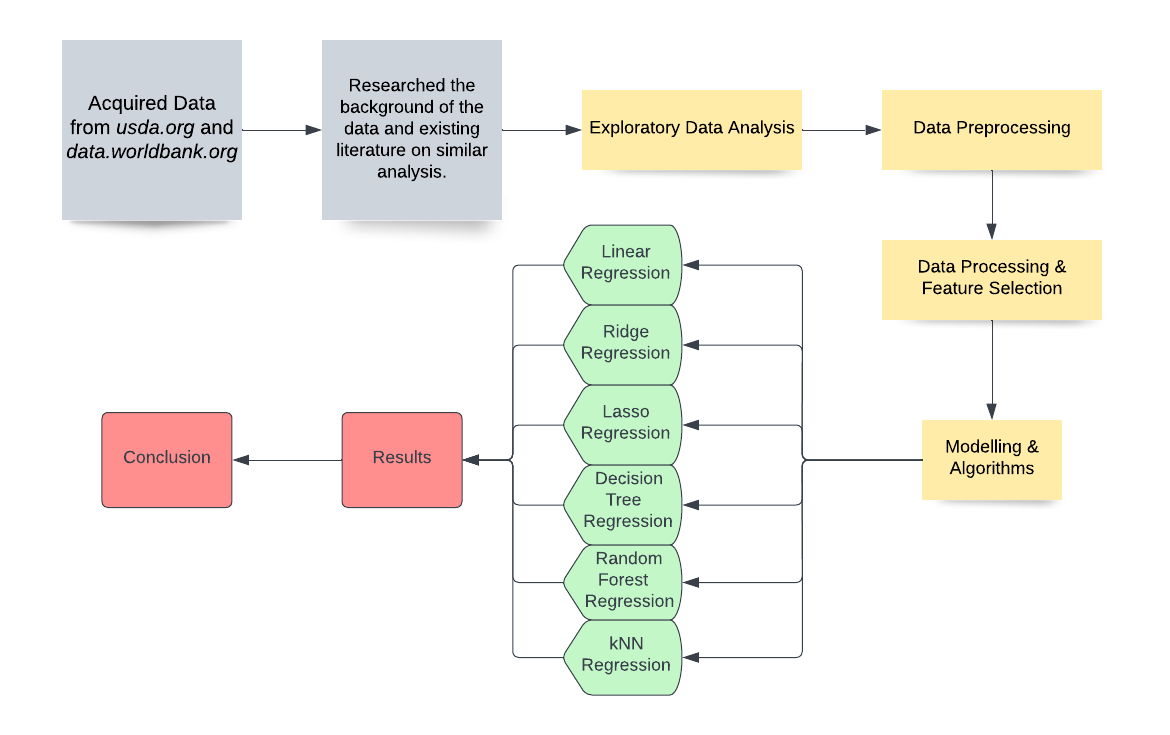
Project description: The goal of this project is to build a Machine Learning model that is capable of predicting the amount of grain, specifically barley, wheat and corn, and sunflowerseed oil being produced in a calendar year, in Ukraine. The two sources of the data used in this project were United States Department of Agriculture (USDA) and World Bank. Three linear models (Multi-variable Linear Regression, Ridge Regression, Lasso Regression) and three non-linear models (Decision Tree Regression, Random Forest Regression and k-Nearest Neighbors Regression) were trained, tested and compared. Root Mean-Squared Error (RMSE) was used as a metric to compare the models. In the end, the model with the smallest RMSE on the test dataset is identified as the most suitable model for use as a tool to predict amount of grain and seed oil production in Ukraine.
This project was presented at the IBDAP 2022 Big Data Anatlytics Conference, which was held in Bangkok, Thailand. The paper has been published recently by IEEE, which can be accessed HERE. The code for this project can be found in my Github repo.
1. Project Motivation: The recent invasion of Ukraine by Russia can have global consequences.
In 2021, Ukraine was one of the top grain and seed oil producers in the world. Four of its primary commodities, which brought in over 1 billion dollars each in export sales in 2021, were wheat, barley, corn, and sunflower oil seed (also simply referred to as sunflower seed or sunflower oil). The February 24th invasion by Russia could negatively impact Ukraine’s ability to keep the same production (and export) level for its primary products. With countries such as Egypt, Indonesia, and the Philippines being heavily dependent on grains and seed oil from Ukraine, the impact of this war could extend the borders of Ukraine. It could disrupt the global economic trends and even cause food shortages. Therefore, it is important to learn which factors affect the amount of grain and seed oil being produced in Ukraine, more than others. Additionally, it would be beneficial to have a Machine Learning model that is capable of predicting amount of grain/seed oil production in Ukraine based on these factors. The data that were primarily used for the analysis were yearly agricultural statistics (import, export, production, etc.) between 1987 and 2021 (USDA) and the population data for the corresponding years (World Bank).

2. Project Workflow Chart
3. Exploratory Data Analysis (EDA)
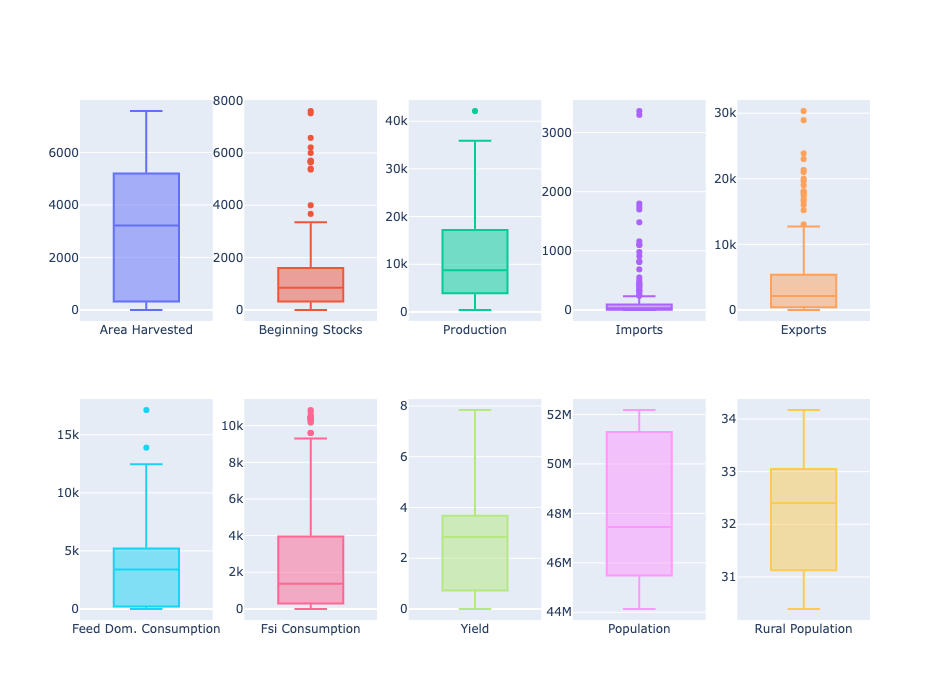
Boxplots were created using Plotly to observe the spread/skew of the independent variables. The most skewed variables were Beginning Stocks, Imports, Exports, Feed Dom. Consumption and Fsi. Consumption. However, since the size of the dataset is small, the skewed variables/columns were not dropped.
(Note: ‘Fsi’ stand for ‘Feed, Seed and Indsutrial’ and virtually refers to consumption by humans and pets while Feed Dom. (Domestic) Consumption refers to consumption by farm animals.)
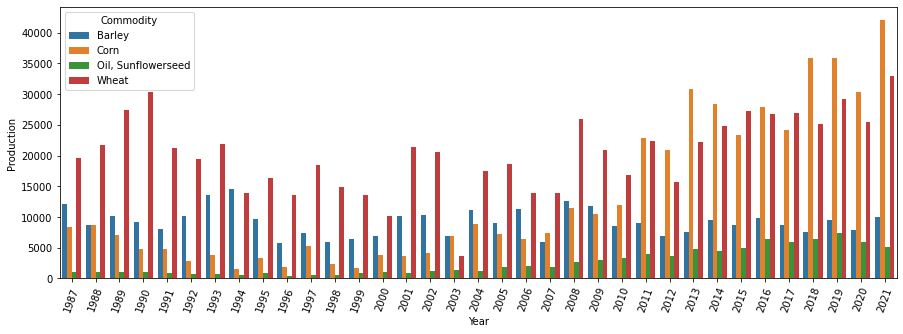
The following plot shows how the production levels of the four primary commodities of Ukraine (barley, corn, wheat and sunflowerseed oil) have changed over the years since 1987. Notice that corn has emerged as Ukraine’s most produced commodity in the last few years.
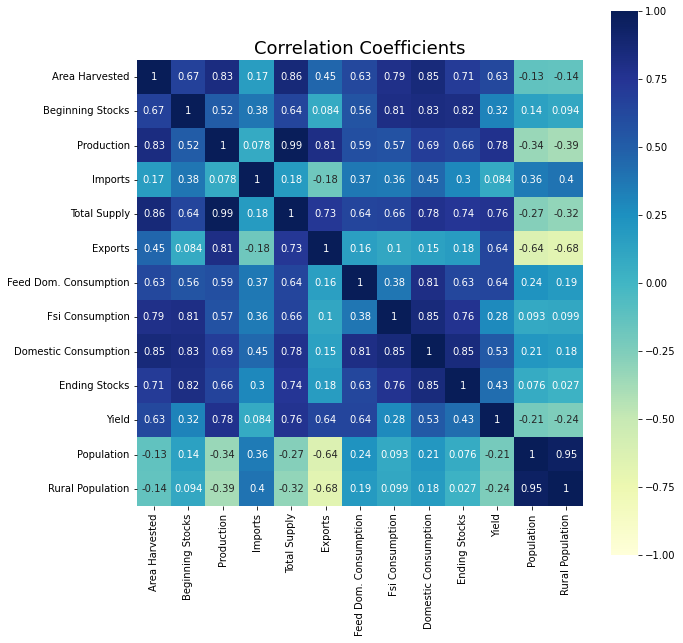
An important step before training ML models is the feature selection. Seaborn’s correlation heatmap allows one to see how strongly the independent variables are correlated with one another and with the dependent variable. For example, Total Supply has the (pearson) correlation value of 0.99 with Production but it also has 0.85 correlation with Area Harvested, which is another feature. With the interest of keeping the number of features in the dataset small, one can drop Total Supply or Area Harvested. Similarly, Population and Rural Population have a strong correlation of 0.95 between them and one can drop one of those features from the dataset. The criteria and full thought processes involved in the feature selection step of the project can be in the paper, linked at the top of this page.
4. Model Development and Results
The features left in the dataset after the feature selection were Commodity, Area Harvested, Beginning Stocks,Exports, Domestic Consumption, Yield and Rural Population. Using these 7 features, the six models (multilinear, ridge, lasso, decision tree, random forest, kNN) were trained to predict the production amount.
Comprehensive hyperparameter search was done using LassoCV (for Lasso Regression), RidgeCV (for Ridge Regression) and GridSearchCV (for Decision Tree, Random Forest and kNN). After getting the optimal values for the hyperparameters, each model was trained and test 1000 times, using 1000 different train-test splits of the dataset. At the end, average training and testing RMSE was calculated and tabulated for each model.
The table below shows the training and testing RMSEs for the six models. Note that all the values inside the table are in 1000 MT (Megatonnes), which is the same unit as Production in the data.
| Model | Train Error | Test Error |
|---|---|---|
| Multi-linear | 948.480 | 1030.839 |
| Ridge | 948.888 | 1030.053 |
| Lasso | 948.916 | 1030.042 |
| Decision Tree | 8.523 | 2327.817 |
| Random Forest | 676.098 | 1701.885 |
| kNN | 1424.678 | 2151.700 |
Even with hyper-parameter tuning using GridsearchCV module, one can see that the decision tree model has a testing error of 2327.817, which is the highest of all six models. On the other hand, the training error for the decision tree is 8.523. This suggests that the model is highly over-fitting, which decision trees are known for, especially for the smaller data sets. Over-fitting is also observed in the random forest model, albeit to a lesser degree, where training and testing errors were 676.098 and 1701.853, respectively.
On the other hand, the linear models were more accurate, with slight differences in RMSEs between the three. Lasso has smallest testing error among the three models.
Even though Lasso has been identified as the best performing model out of the six, it is still difficult to gauge its usefulness. Without much context, the RMSE error values inside the results table above may either seem too large or too small. Therefore, another metric called RMSPE (Root Mean-Squared Percentage Error) was calculated in order to put context in the testing RMSE value of Lasso model, shown in the results table above. The RMSPE value of the lasso regression model was 9.09%.
While this project was coming to an end, the USDA published the data for 2022. Therefore, this next calculation was not included in the paper itself. The table below shows the actual production values of corn, wheat, barley and sunfloweroil seed, alongside the production values predicted by the Lasso model.
| Commodity | Actual Production Values for 2022 (in 1000 MT) | Predicted Values (in 1000 MT) |
|---|---|---|
| Barley | 6400 | 6864.80 |
| Corn | 31500 | 25668.70 |
| Wheat | 20500 | 19959.90 |
| Sunfloweroil Seed | 10500 | 10701.89 |
The RMSPE was calculated again for the Lasso Model on this new 2022 test dataset. It came out to be 10.08%.
For more details see GitHub Flavored Markdown.